HOUSE PRICE INDEX
Area analysis
Explore house price movements in Türkiye, the Aegean and Southern Marmara using TCMB index series.
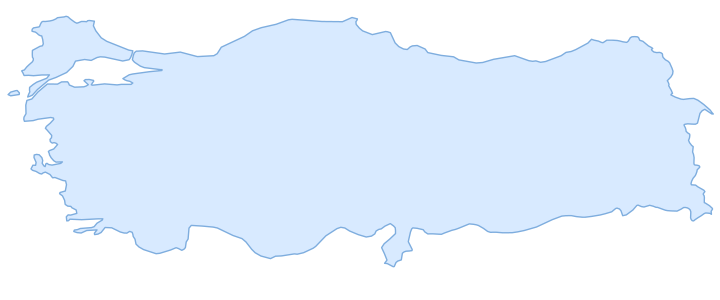
Türkiye overall
Index trend
September 2026 · Index points239.38
+1.22% The index tracks changes in residential property prices over time. Values are index points. Some series cover more than one province.
TCMB · EVDSChart data table
| Period | Index points |
|---|---|
| April 2026 | 223.32 |
| May 2026 | 226.99 |
| June 2026 | 231.34 |
| July 2026 | 234.55 |
| August 2026 | 236.50 |
| September 2026 | 239.38 |
August 2026
Compare regions
| Region | Index points | Month on month |
|---|---|---|
| 236.50 | +0.83% | |
| 229.59 | +2.74% | |
| 235.27 | +1.09% | |
| 222.99 | −0.26% | |
| 257.01 | +0.99% | |
| 234.62 | +2.51% |